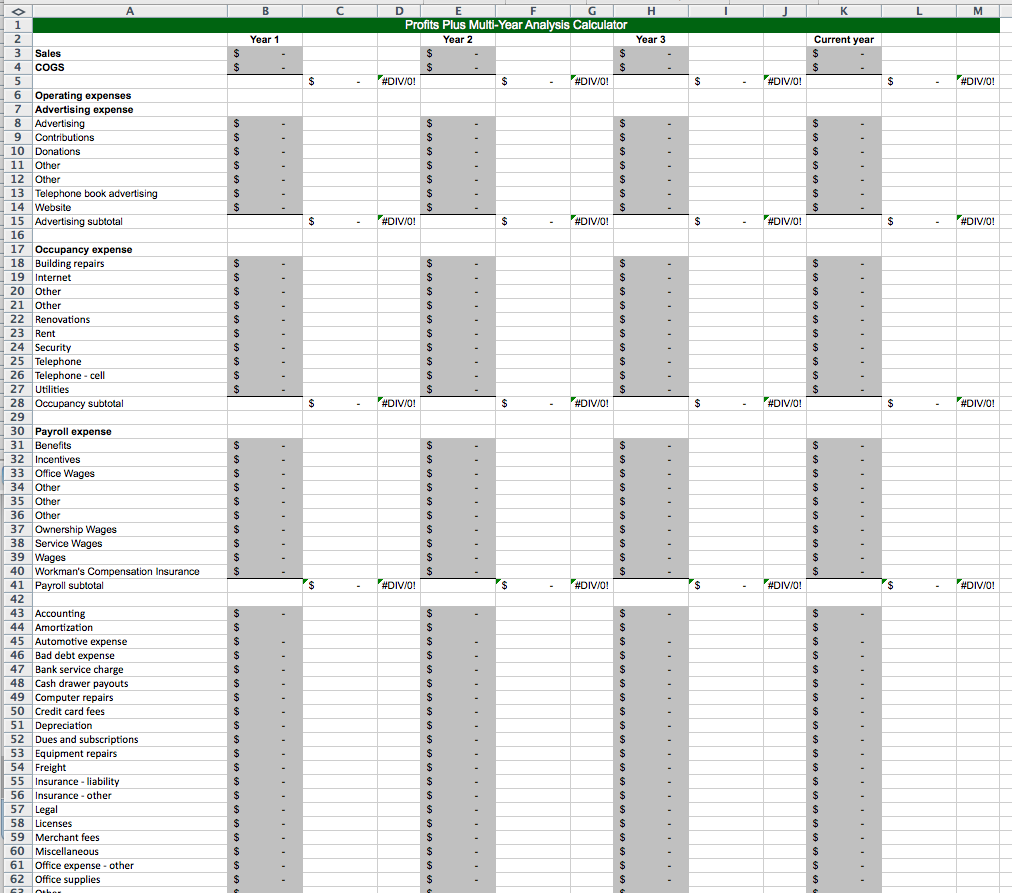
The multi-year analysis calculator was created as a result of an experience in working with a business owner. Over a period of several years, the sales and profit of the business had increased. As they should be, the owner was very proud of their efforts. However, when we took a look at how that growth had occurred there were several points that stood out. The first was that the gross margin had wavered over the years and in the most profitable year they did not have their best gross margin.
When we looked at the groups of operating expenses, advertising, occupancy and payroll, as well as operating expenses overall, we saw there were fluctuations. With the fluctuation in advertising expense as a percentage of sales, you could see that an advertising budget was not utilized. You could see with payroll as the sales increased and decreased over the same four years, that with the addition of a new employee as sales increased, there were not fewer employees in the years with lesser sales.
Overall the owner was pleased with their efforts. However, if controls of margins and expenses, the net profit would have been 1.5 times what it actually was in the best year.
This calculator from Tom Shay helps you to detect those patterns.


